 The power of pixels
 Code examples
Here are some code examples used in the workshop activities, for reference when needed :-)
These examples use the following packages:
– magick
– gganimate (from github)
– ggimage
– nullabor
– tidyverse
and assume that you’re working within a project.
getting images into R
We’ll use the R package magick to read images into R and do some exploration and manipulation of the image data. This example uses images from the CC0 image site pexels.com.
library(magick)

# read an image
imageURL <- "https://images.pexels.com/photos/21492/pexels-photo.jpg"
image_read(imageURL)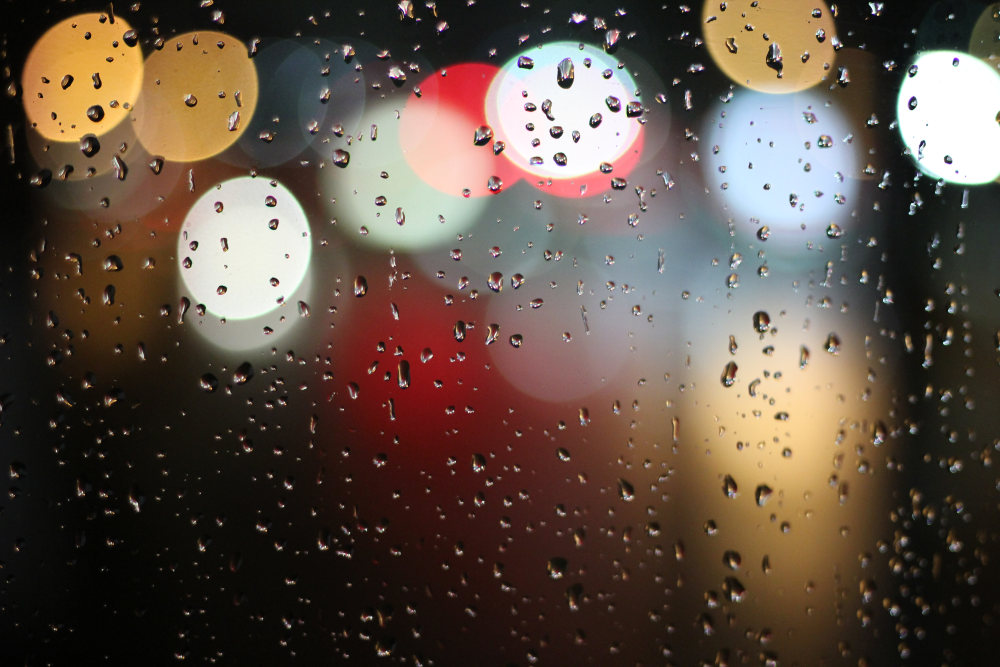
# scale it down to reduce the pixels
image_small <- image_read(imageURL) %>%
  image_scale("10")

# and blow it up to see those pixels
image_small %>%
  image_scale("200")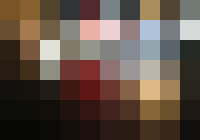
# get data about the image
img_data <- image_small %>%
  image_data()

# and show the matrix just for the red component (in hex)
img_matrix <- t(img_data[1,,])
img_matrix
## [,1] [,2] [,3] [,4] [,5] [,6] [,7] [,8] [,9] [,10]
## [1,] 78 85 51 31 50 79 39 a9 53 73
## [2,] 69 a4 6f 88 ea eb 95 ae 77 d5
## [3,] 2c 79 e1 81 93 82 85 93 5c 24
## [4,] 26 40 8f 6c 7f 8f 9b bc 79 2a
## [5,] 12 15 21 40 5e 6a 86 dc a2 27
## [6,] 0c 0e 12 20 33 42 4c 87 6b 1e
## [7,] 06 07 0c 13 1d 2b 2a 45 37 11# reduce the image down to just one colour and display
image_small %>%
image_scale("200") %>%
image_quantize(max=1)
# convert the image to grayscale and save the image data
gs_data <- image_small %>%
  image_quantize(colorspace = "gray") %>%
  image_data()

# and show the matrix just for the red component (in hex)
gs_matrix <- gs_data[1,,] %>%
  t()
gs_matrix
## [,1] [,2] [,3] [,4] [,5] [,6] [,7] [,8] [,9] [,10]
## [1,] 58 66 44 33 32 81 3c 90 47 78
## [2,] 52 81 60 88 bb d6 84 c0 7c d8
## [3,] 21 5d e0 7b 94 82 8a a2 63 28
## [4,] 1d 32 8e 42 41 79 97 b6 70 28
## [5,] 11 12 1c 20 26 40 68 bd 86 24
## [6,] 0c 0d 10 15 1b 29 37 6a 53 1b
## [7,] 06 07 0b 0f 13 1c 1e 34 2a 0f# create one long vector of all the pixels with the red component
# because it's grayscale, red = green = blue
gs_vector <- gs_data[1,,] %>%
as.vector()
gs_vector## [1] 58 66 44 33 32 81 3c 90 47 78 52 81 60 88 bb d6 84 c0 7c d8 21 5d e0
## [24] 7b 94 82 8a a2 63 28 1d 32 8e 42 41 79 97 b6 70 28 11 12 1c 20 26 40
## [47] 68 bd 86 24 0c 0d 10 15 1b 29 37 6a 53 1b 06 07 0b 0f 13 1c 1e 34 2a
## [70] 0f# create a dataframe of the pixels converted to rgb (red component)
gs_df <- data.frame(gs = as.numeric(gs_vector), stringsAsFactors = FALSE)
gs_df# reduce the grayscale image down to just one colour and display
gs_one <- image_small %>%
image_scale("200") %>%
image_quantize(colorspace = "gray") %>%
image_quantize(max=1)
# get the red component value
rgb_colour <- image_data(gs_one)[1,,][1,1] %>%
as.numeric() %>%
as.character()
# take the one colour grayscale image
# and display the red component value on top
gs_one %>%
image_annotate(rgb_colour, size=30,location="+75+50")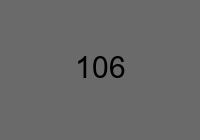
# let's explore the photos from the match up activity
# read them once since they are BIG files
cute_cats <- c("https://images.pexels.com/photos/774731/pexels-photo-774731.jpeg","https://images.pexels.com/photos/1084425/pexels-photo-1084425.jpeg","https://images.pexels.com/photos/1049764/pexels-photo-1049764.jpeg","https://images.pexels.com/photos/104827/cat-pet-animal-domestic-104827.jpeg","https://images.pexels.com/photos/315582/pexels-photo-315582.jpeg") %>%
  image_read() %>%
  image_scale("200")

# which was cat 1?
cute_cats[1]
plots + images
We’ll add the use of R packages from the tidyverse, specifically readr, dplyr and ggplot2, as well as the packages ggimage to visualise data about movies with robot in their title using our own robot icons and gganimate to liven things up.
First, use the drawing tool to create your own robot icon and copy the URL link to your image. You’ll need to change this link in the code below :-)
library(tidyverse)
library(magick)
library(ggimage)
library(gganimate)

# view your image in R
image_read("https://drive.google.com/uc?export=download&id=1muwNrReMtBJIOZaXKlN_hVGFe-shhi0e") %>%
  image_scale("400")
# save it!
image_read("https://drive.google.com/uc?export=download&id=1muwNrReMtBJIOZaXKlN_hVGFe-shhi0e") %>%
  image_write("myrobot.png")

# read in robot data
robot_df <- read_csv("https://docs.google.com/spreadsheets/d/e/2PACX-1vTAvomBmRHCu6T3Mewu3yuEHy8eViekI2WXJTOLDxDrldXc-gYEE2LjiWa1CTgXmXRRJFqf5leNn4NW/pub?gid=0&single=true&output=csv")
robot_df
# group data by year and count movies
movies <- robot_df %>%
group_by(Year) %>%
summarise(num_movies = n())
movies# we probably should add 0 counts for years
# with no robot movies
movies <- robot_df %>%
group_by(Year) %>%
summarise(num_movies = n()) %>%
complete(Year = seq(min(Year),
max(Year)),
fill = list(num_movies = 0))
movies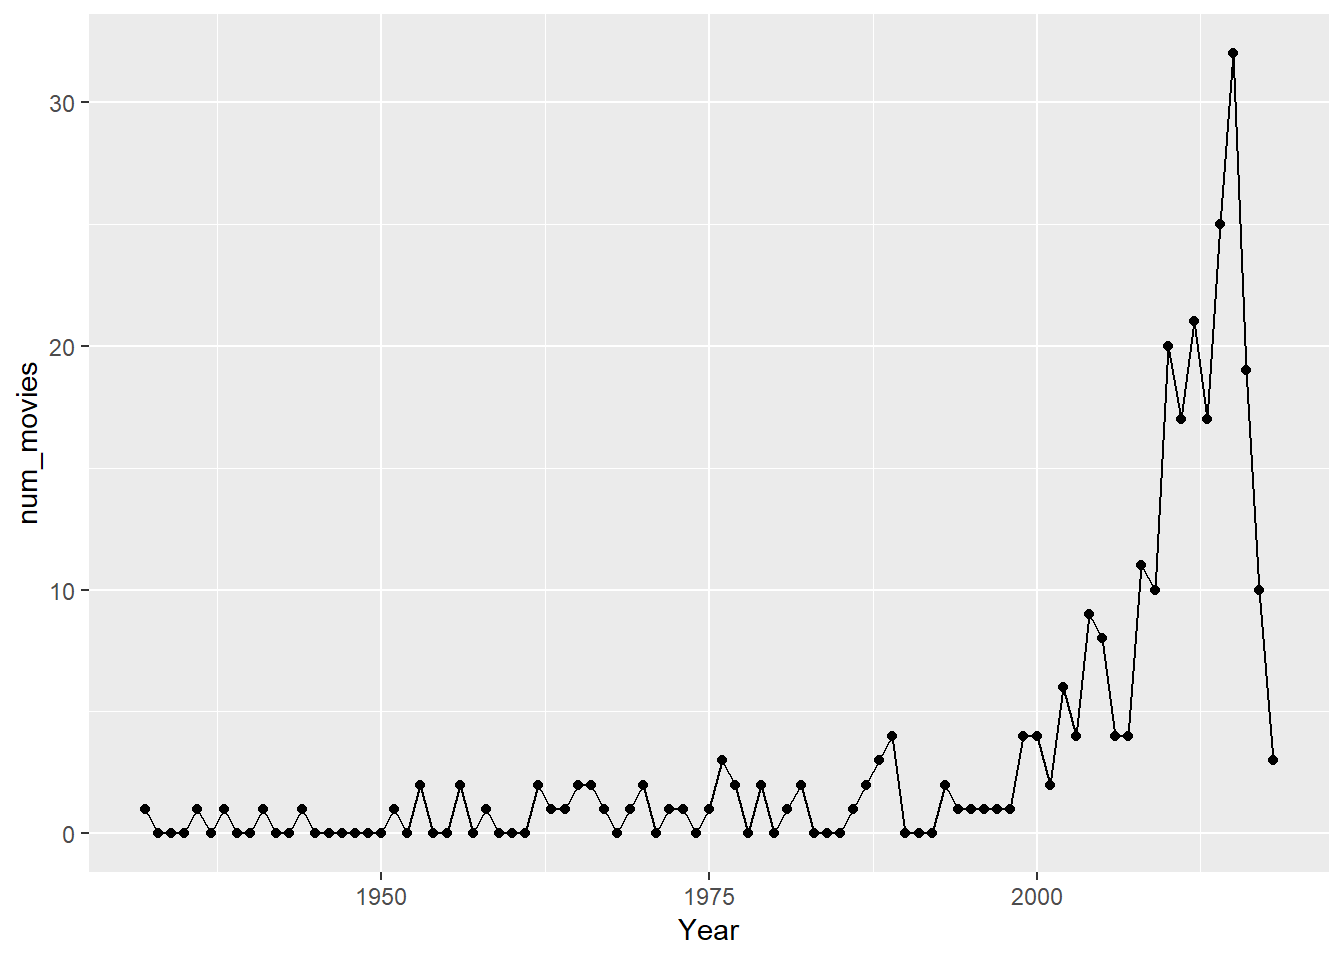
# replace points with robot
movies %>%
  ggplot(aes(x=Year, y=num_movies)) +
  geom_line() +
  geom_image(aes(image = "myrobot.png"), size=0.05)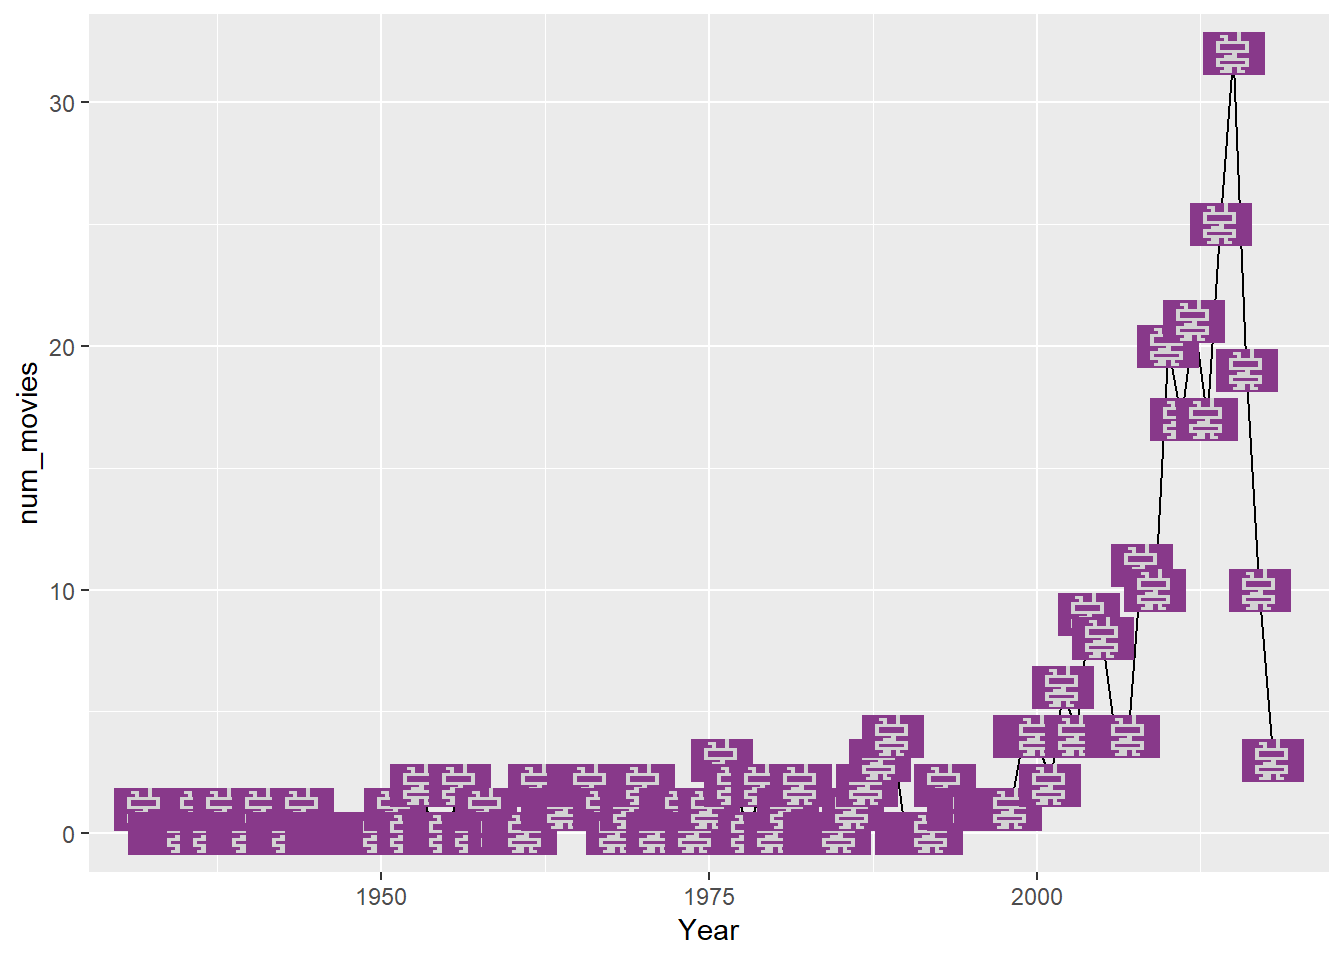
# make the robot fly
movies %>%
  ggplot(aes(x=Year, y=num_movies)) +
  geom_image(aes(image = "myrobot.png"), size=0.05) +
  transition_time(Year)
clustering images
We’ll read in a random sample of 225 drawings of ducks from the Google Quick! Draw! dataset and see if we can group them into similar drawings using k-means clustering.
Download the duck images as a ZIP folder from here and save them into a folder within your project folder called “ducks”.
library(tidyverse)
library(magick)
library(ggimage)

# read the duck images in
# from the project folder ducks
# and layout drawings in grid
folder <- "ducks/"
ducks_df <- list.files(path=folder) %>%
  paste0(folder,.) %>%
  data.frame(imageLoc = .,
             stringsAsFactors = FALSE) %>%
  mutate(x = (row_number() - 1) %% ceiling(sqrt(n())) + 1,
         y = ceiling(row_number() / ceiling(sqrt(n()))))

ggplot(ducks_df, aes(x, y)) +
  geom_image(aes(image=imageLoc)) +
  scale_x_continuous(limits=c(0, ceiling(sqrt(nrow(ducks_df))) + 1)) +
  scale_y_continuous(limits=c(0, ceiling(sqrt(nrow(ducks_df))) + 1)) +
  theme_void()  +
theme(aspect.ratio=1) 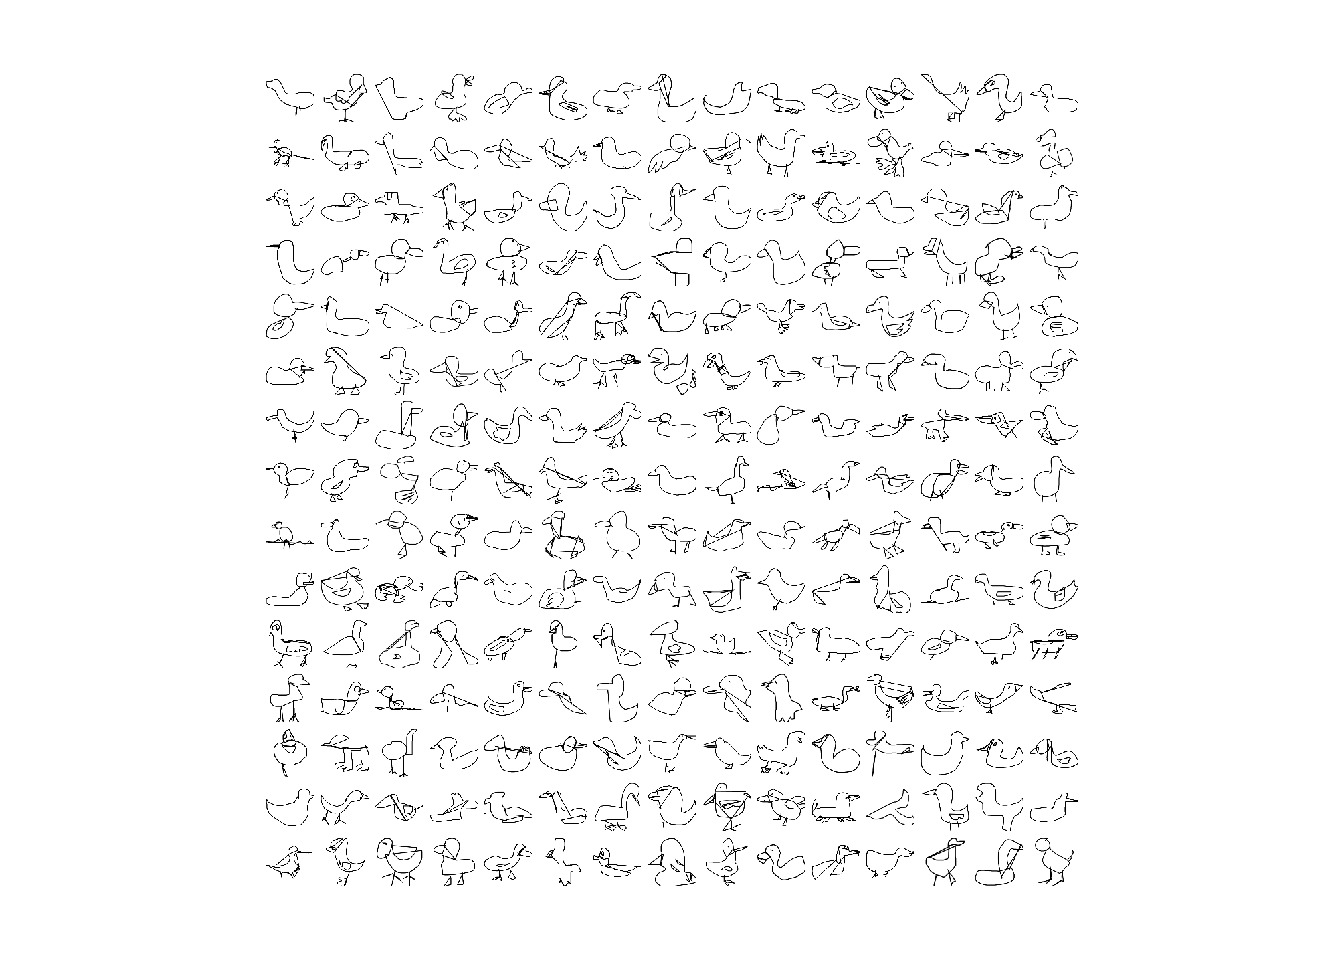
# ggsave("drawinggrid.png")

# function to read image data for each duck
# as one row of 100 variables (one for each pixel)
convert_data <- function(x)
{
  pic <- image_read(x) %>%
    image_scale("10x10") %>%
    image_background("white") %>% # need this as transparent background
    image_convert(type = 'Bilevel')

  image_data(pic)[1,,] %>%
    as.vector() %>%
    as.numeric() %>%
    t() %>%
    data.frame(stringsAsFactors = FALSE)
}

# take ducks_df imgLoc and map to convert_data function
# store in image_data df
image_data <- ducks_df$imageLoc %>%
  map_df(convert_data)

# cluster time!
set.seed(1810)
num_clust <- 2
images_km <- kmeans(image_data, centers = num_clust)

# check fit numerically
images_km$tot.withinss/images_km$totss
## [1] 0.9224833# add cluster info
ducks_df$cluster <- as.factor(images_km$cluster)
# plot with colour overlay for each cluster
ggplot(ducks_df, aes(x, y)) +
geom_image(aes(image=imageLoc)) +
geom_tile(aes(fill=cluster), alpha = 0.5) +
scale_x_continuous(limits=c(0, ceiling(sqrt(nrow(ducks_df))) + 1)) +
scale_y_continuous(limits=c(0, ceiling(sqrt(nrow(ducks_df))) + 1)) +
theme_void() +
theme(aspect.ratio=1) 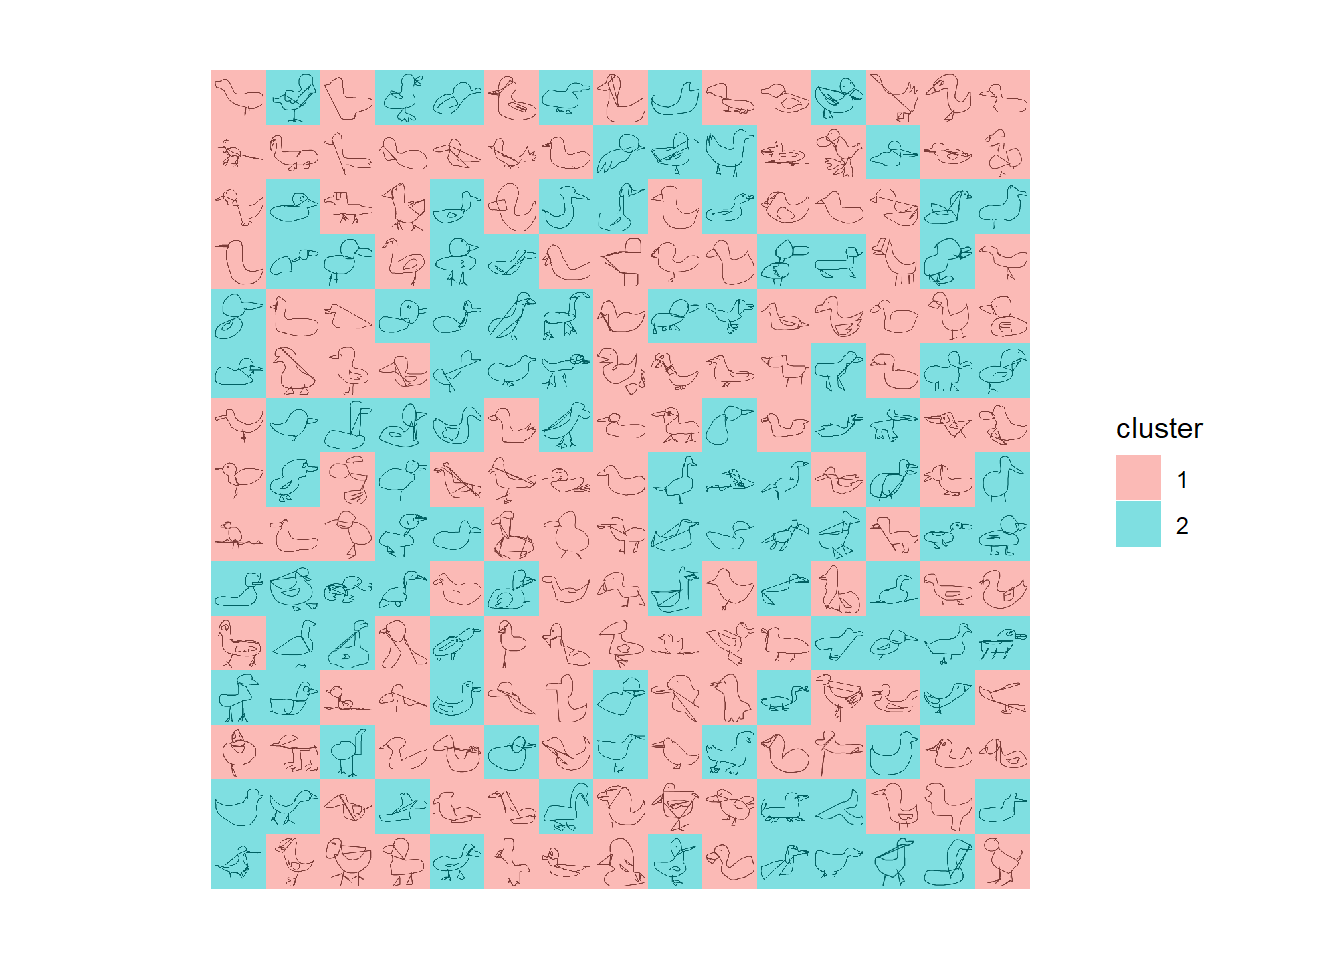
# overlay ducks from the same cluster
duck_clusters <- ducks_df %>%
  mutate(x = as.numeric(cluster),
         y = 0.5)

# plot clusters - check fit visually
ggplot(duck_clusters, aes(x, y)) +
  geom_image(aes(image=imageLoc),
             alpha = 0.05, size=1/(num_clust + 2)) +
  scale_x_continuous(limits=c(0, num_clust + 1)) +
  scale_y_continuous(limits=c(0, 1))  +
  theme_void()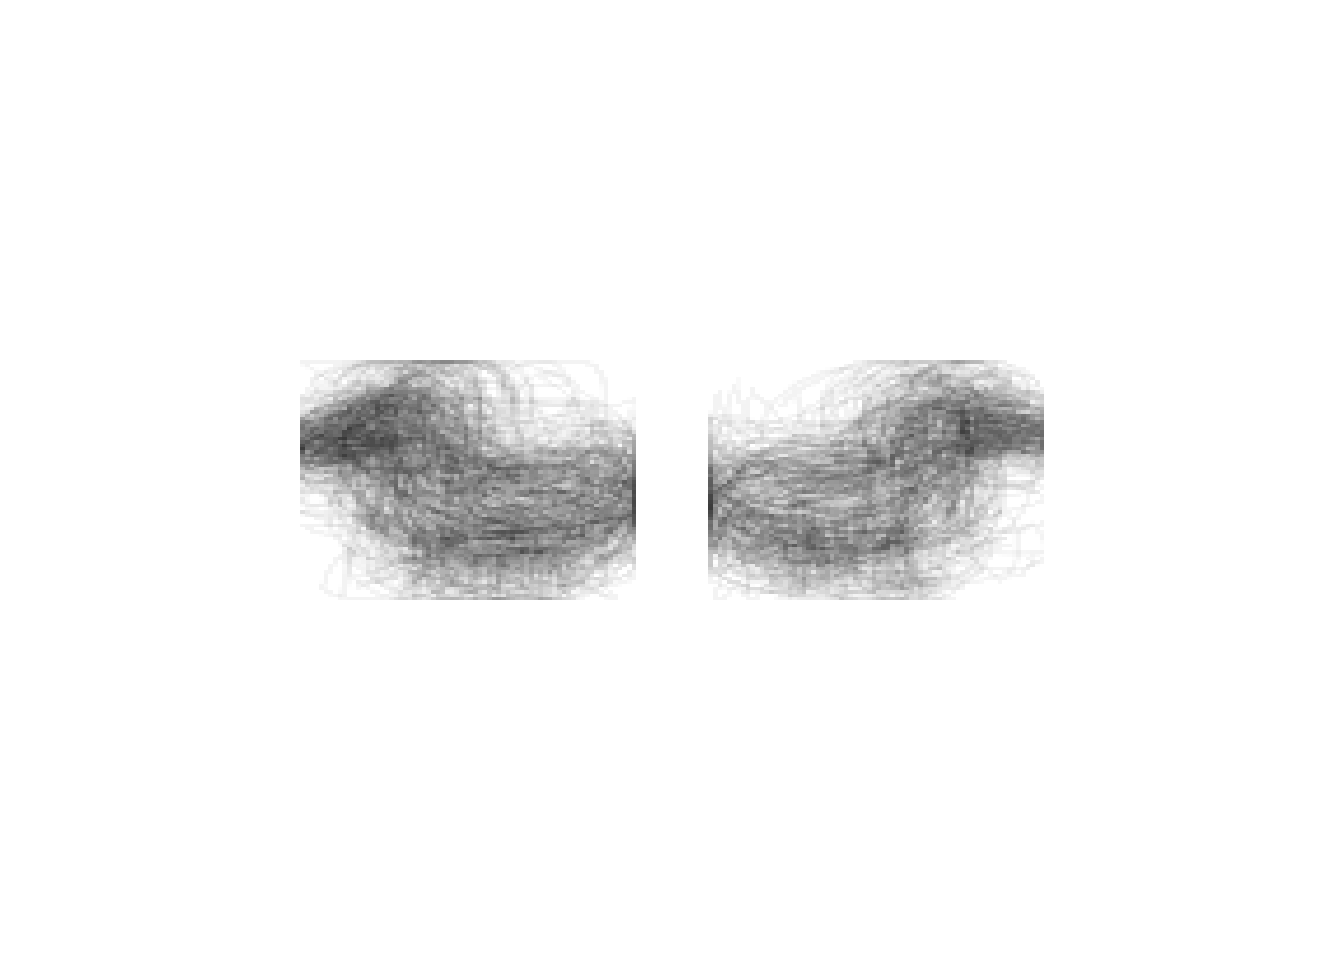
pixelated animation
We’ll create images with text from scratch, take each pixel from an image and plot them individually, and then created some animated word text fun times!
library(magick)
library(tidyverse)
library(gganimate)

# set up image size
image_width = 400
image_height = 120

# create a image with the text
word <- image_blank(width = image_width,
                    height = image_height) %>%
  image_background("#D3D3D3") %>%
  image_annotate("pixelated",
                 color = "#181818",
                 size = 60,
                 location = "+85+1") %>%
  image_annotate("animation",
                 color = "#181818",
                 size = 60,
                 location = "+80+48")

# create a dataframe with co-ordinates for each pixel
words_df <- expand.grid(x=1:image_width,
                        y=1:image_height)

# get the hex value by combining r, g, b
word_colours_hex <- paste0("#",
                           image_data(word)[1,,],
                           image_data(word)[2,,],
                           image_data(word)[3,,])

# add hex to dataframe
words_df$hex <- word_colours_hex

# plot the pixels as tiles with colour
# we need to plot the y co-ordinates in reverse
# since pixels in drawings are in reference to top left corner
# but plotting points is in reference to bottom left corner
words_df %>%
  ggplot() +
  geom_tile(aes(x, y, fill=hex)) +
  scale_fill_identity() +
  scale_y_reverse(limits=c(image_height+1, 0)) +
  theme_void() +
theme(aspect.ratio=image_height/image_width)![]()
# pixelate just the text
pixel_size = 3
pixels_df <- words_df %>%
  filter(hex=="#181818") %>%
  mutate(x = ceiling(x/pixel_size)*pixel_size,
         y = ceiling(y/pixel_size)*pixel_size) %>%
  distinct()

# plot the text pixels on top of the background
pixels_df %>%
  ggplot() +
  geom_tile(aes(x, y), fill="#181818") +
  scale_y_reverse(limits=c(image_height+1, 0)) +
  theme_void() +
  theme(aspect.ratio=image_height/image_width,
        panel.background =
element_rect(fill = "#D3D3D3"))![]()
# now we want to create another version of the plot
# where the co-ordinates are random
pixels_df_rand <- pixels_df %>%
  mutate(phase = 1,
         x = round(runif(n(), min = 1, max = image_width)),
         y = round(runif(n(), min = 1, max = image_height)))

pixels_df_true <- pixels_df %>%
  mutate(phase = 2)

# combine them together
pixels_df_anim <- bind_rows(pixels_df_rand, pixels_df_true)

# and animate by phase!
pixels_df_anim %>%
  ggplot() +
  geom_tile(aes(x, y),
            fill="#181818",
            width = pixel_size,
            height = pixel_size) +
  scale_y_reverse(limits=c(image_height+1, 0)) +
  theme_void() +
  theme(aspect.ratio=image_height/image_width,
        panel.background =
          element_rect(fill = "#D3D3D3")) +
  transition_states(phase,
                    transition_length = 1,
                    state_length = 1)  +
ease_aes('sine-in-out')![]()
la pièce de résistance
Lastly, let’s add a non-conventional use of the R package nullabor to create some sparkling lights for an Eiffel Tower mosaic made from Unsplash photos of Paris.
Download the Unsplash paris images as a ZIP folder from here and save them into a folder within your project folder called “paris”.
# funtimes with images
library(tidyverse)
library(magick)
library(ggimage)
library(nullabor)
library(gganimate)
set.seed(1810)

# create your own drawing of the Eiffel tower
# and save as eiffel.png
# you can use the drawing tool or whatever
image_read("https://drive.google.com/uc?export=download&id=1RELVlFC8-DOm56s8OqIjKLQO196_wvXI") %>%
  image_write("eiffel.png")

# set the cols for the square grid layout
ncols <- 15
sample_size <- ncols*ncols

# get the names of all the paris images
folder <- "paris/"
pics <- data.frame(imgLoc = list.files(path=folder),stringsAsFactors = FALSE)

# get the "average" colour of each image
# and store a bunch of colour-related info
colours <- map_df(1:nrow(pics), function(i) {
  imgLoc <- paste0(folder,pics$imgLoc[i])
  picster <- image_read(imgLoc) %>%
    image_quantize(max=1) %>%
    image_data()
  components <- as.numeric(picster[1:3,1,1])
  r <- components[1]
  g <- components[2]
  b <- components[3]
  hex <- rgb(r/255, g/255, b/255)
  hsl <-rgb2hsv(r, g, b, maxColorValue = 255)
  gs <- round((r + g + b)/3) #could use other methods
  data.frame(r, g, b, gs, hue = hsl[1], sat = hsl[2], light = hsl[3], x=((i-1)%%ncols)+1,
             y=ceiling(i/ncols), hex, imgLoc, stringsAsFactors=FALSE)
})
colours
# read in my eiffel tower drawing
# scale down if needed to match grid size
# and convert to black and white only
tower <- image_read("eiffel.png") %>%
image_scale(paste0(ncols,"x",ncols)) %>%
image_convert(type="bilevel")
# if you've used my drawing tool
# the tower is white when converted
# to black and white - check yours
tower %>%
image_scale("400")
# read the image data for your tower
hex_data <- image_data(tower)
hex_colour <- paste0("#",hex_data, hex_data, hex_data)

# create a data frame from the pixels
# grab the coordinates then arrange from light
# to dark e.g. #ffffff then #000000
# if your tower is black, remove desc()
pixelsdf <- data.frame(hex = hex_colour) %>%
  mutate(x = (row_number() - 1)%%ncols + 1, y = ceiling(row_number()/ncols)) %>%
  arrange(desc(hex)) %>%
  mutate(id=row_number())

# how many white pixels (tower)
pixelsdftower <- pixelsdf %>%
  filter(hex=="#ffffff")

# arrange the paris images in order
# from darkest to lightest
# so in mosaic eiffel tower is black/dark
# take how many you need for the tower
towerpixels <- colours %>%
  arrange(light) %>%
  slice(1:nrow(pixelsdftower))

# the rest will be background
# arrange by hue to kinda group colours
backpixels <- colours %>%
  arrange(light) %>%
  slice((nrow(pixelsdftower)+1):nrow(.)) %>%
  sample_n(sample_size - nrow(pixelsdftower)) %>%
  arrange(desc(hue))

# create a reference data frame for mosaic
ref_colours <- bind_rows(towerpixels,backpixels) %>%
  mutate(id=row_number())

# join the ref_colours and pixelsdf (tower)
pixels <- pixelsdf %>%
  left_join(ref_colours, by="id")

# separate them out to use some transparency
# prob could incorporate this earlier!
pixels_tower <- pixels %>%
  slice(1:nrow(pixelsdftower))

pixels_background <- pixels %>%
  slice((nrow(pixelsdftower)+1):sample_size)

# first check of your creation!!
ggplot(data = pixels) +
  geom_tile(aes(x.x,y.x, fill=hex.y)) +
  scale_fill_identity() +
  scale_x_continuous(limits=c(0, ncols+1)) +
  scale_y_reverse(limits=c(ncols+1, 0)) +
  theme_void() +
  theme(aspect.ratio=1)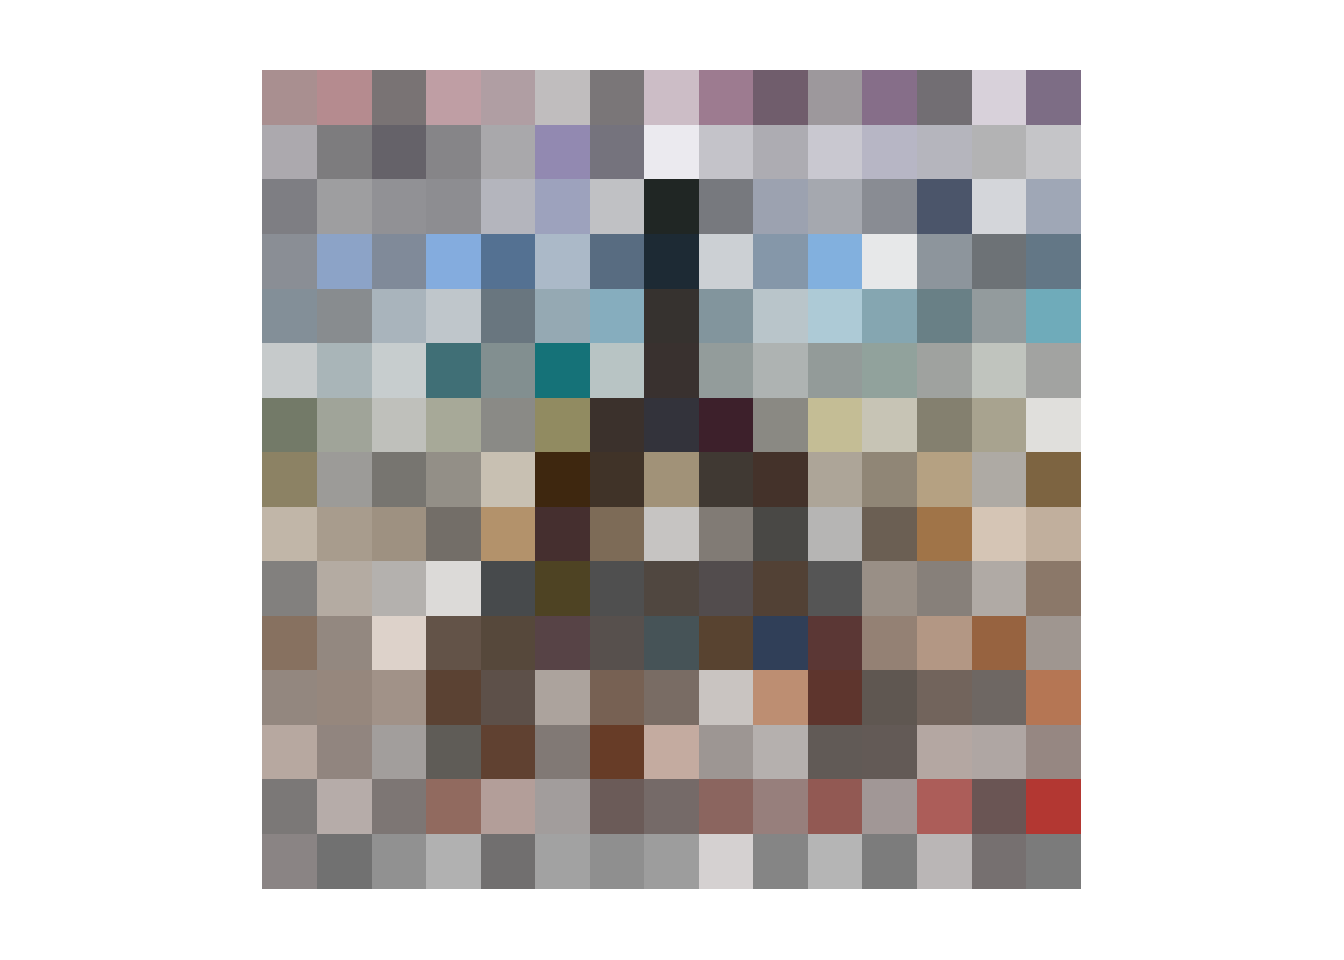
# now with the actual images!!!
ggplot() +
  geom_image(data=pixels,
             aes(x.x, y.x, image=imgLoc),
             size=1/(1.1*ncols)) +
  geom_tile(data=pixels,
            aes(x.x,y.x, fill=hex.y),
            alpha=0.5) +
  scale_fill_identity() +
  scale_x_continuous(limits=c(0, ncols+1)) +
  scale_y_reverse(limits=c(ncols+1, 0)) +
  theme_void()  +
  theme(aspect.ratio=1)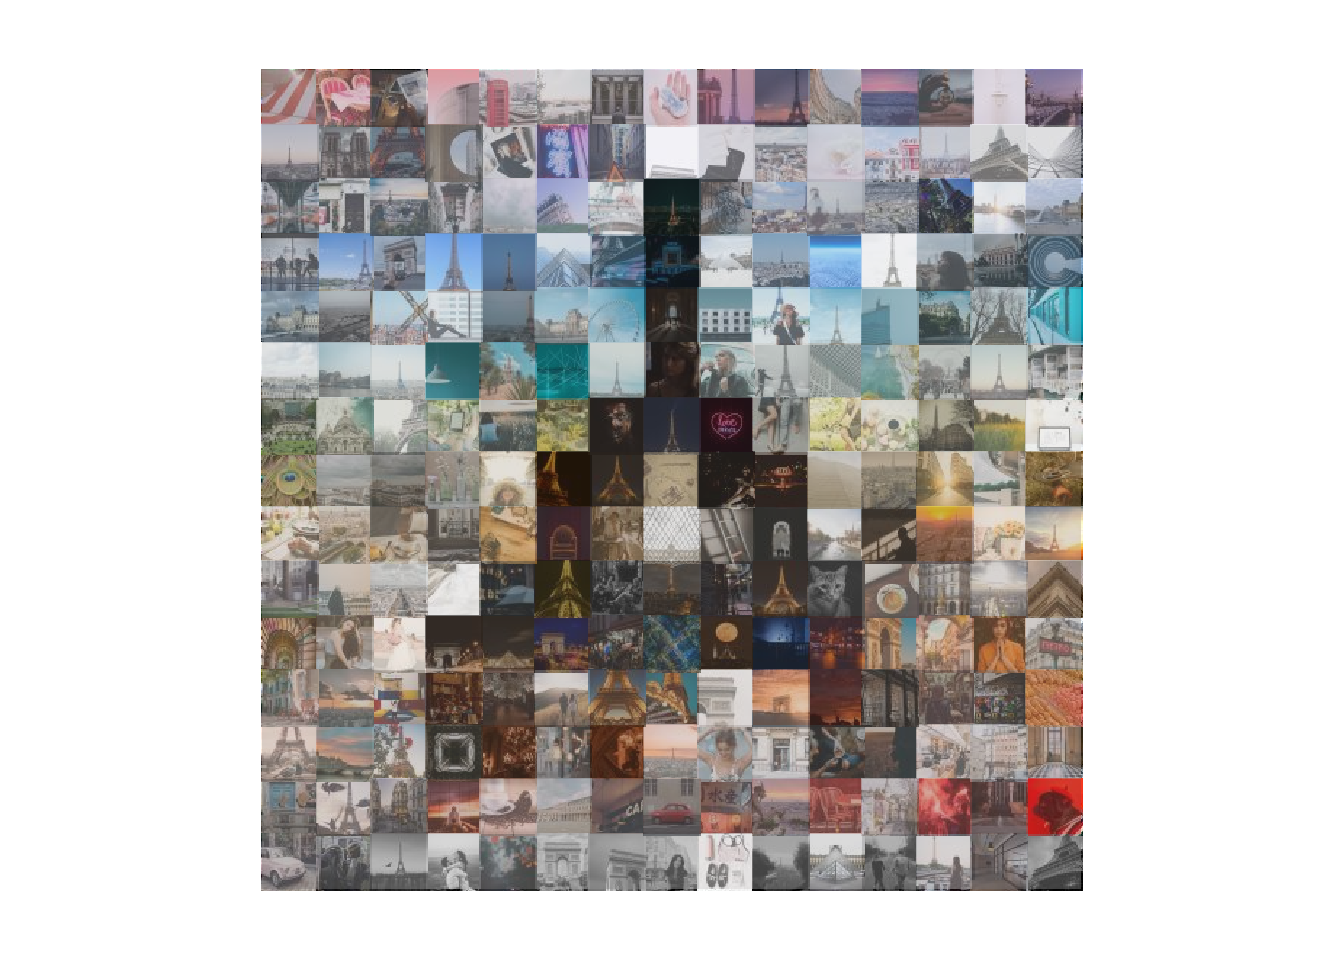
# we can use nullabor to create 19 additional versions
# with the hex colour for the tile overlay randomly permuted
pixels_fun <- lineup(null_permute("hex.y"), pixels)

ggplot() +
  geom_image(data=pixels_fun,
             aes(x.x, y.x, image=imgLoc),
             size=1/(1.1*ncols)) +
  geom_tile(data = pixels_fun,
            aes(x.x,y.x,fill=hex.y),
            alpha=0.5) +
  scale_fill_identity() +
  scale_x_continuous(limits=c(0, ncols+1)) +
  scale_y_reverse(limits=c(ncols+1, 0)) +
  facet_wrap(~.sample) +
  theme_void()  +
theme(aspect.ratio=1) 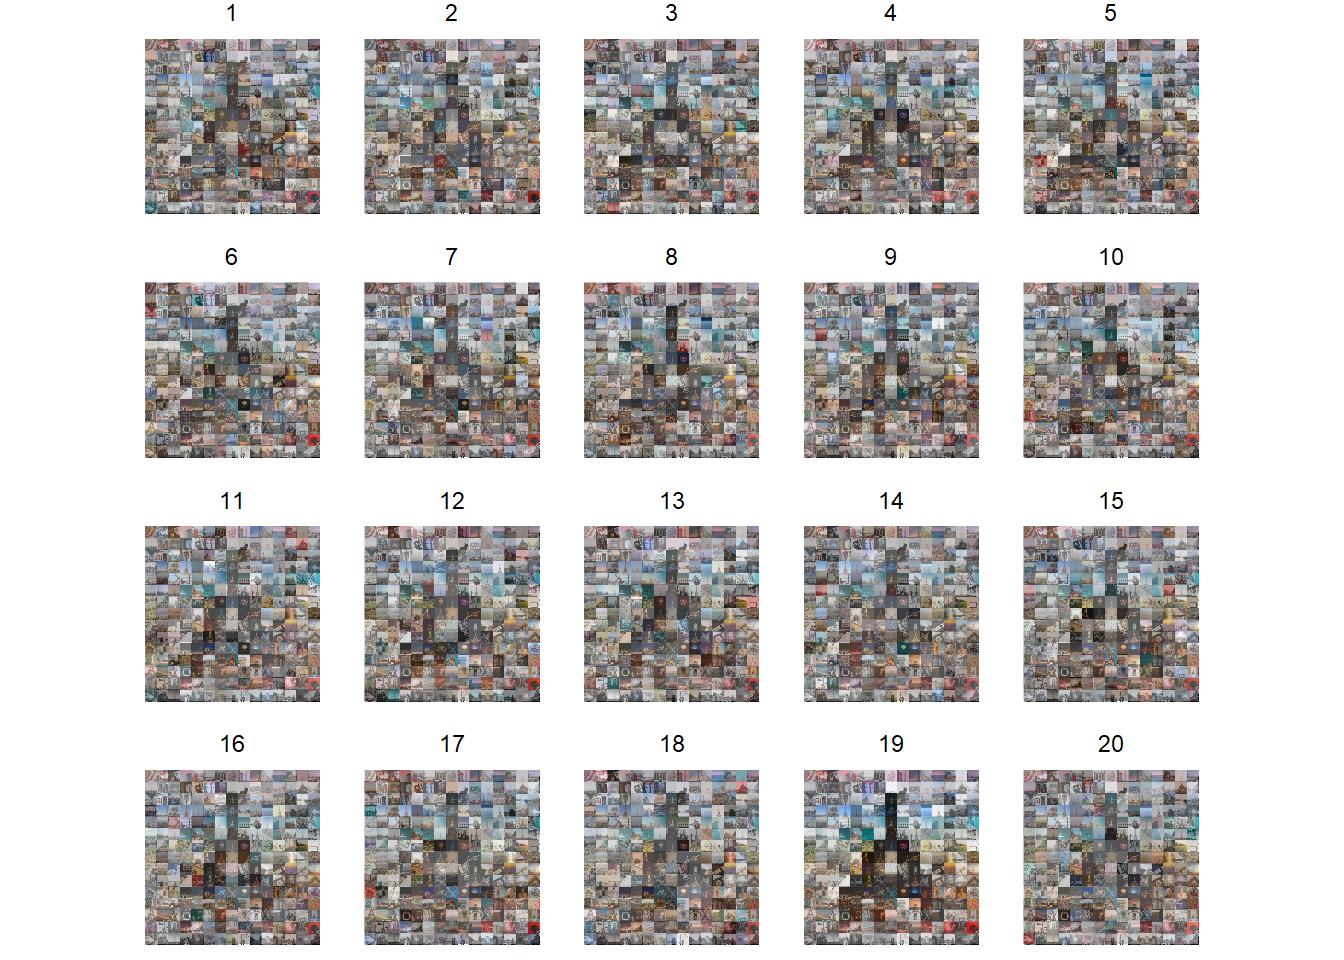
# using all 20 "frames" makes a massive GIF
# so lets just go with five
# making sure on of these is the "real" one
real_frame <- pixels_fun %>%
  filter(.sample == attr(pixels_fun, "pos"))

other_frames <- pixels_fun %>%
  filter(!.sample == attr(pixels_fun, "pos")) %>%
  slice(1:(sample_size*4))

pixels_animate <- bind_rows(real_frame, other_frames)

ggplot() +
  geom_image(data=pixels_animate,
             aes(x.x, y.x, image=imgLoc),
             size=1/(1.1*ncols)) +
  geom_tile(data = pixels_animate,
            aes(x.x,y.x, fill=hex.y),
            alpha=0.5) +
  scale_fill_identity() +
  scale_x_continuous(limits=c(0, ncols+1)) +
  scale_y_reverse(limits=c(ncols+1, 0)) +
  theme_void()  +
  theme(aspect.ratio=1) +
  transition_states(.sample,
                    transition_length = 0,
                    state_length = 0.5)
creating paint colours?
One of the ladies at the workshop made a joke about how paint companies could create colours by reducing photos down to one colour using magick::image_quantize(image, maxcol=1). So let’s make a colour palette of five colours using the Unsplash paris photos!
library(tidyverse)
library(magick)

# get the names of all the paris images
folder <- "paris/"
pics <- data.frame(imgLoc = paste0(folder,list.files(path=folder)),stringsAsFactors = FALSE)

# create a single "image" from these photos
# by appending them after reducing to one pixel
# and one colour
colour_image <- pics$imgLoc %>%
  image_read() %>%
  image_quantize(max=1) %>%
  image_scale("1") %>%
  image_append()

# some of the 330 colours
colour_image %>%
  image_crop("+300") %>%
  image_scale("500")
# reduce this image down to five colours
# and get the hexcodes for each colour
colour_data <- colour_image %>%
  image_quantize(max=5) %>%
  image_data()

hex_colours <- paste0("#",
                           colour_data[1,,],
                           colour_data[2,,],
                           colour_data[3,,])
unique(hex_colours)
## [1] "#908382" "#d1cecf" "#696462" "#a4a2a3" "#b5b5b8"# create a palette
unique(hex_colours) %>%
map(function(x){
image_blank(width = 100,
height = 300,
color = as.character(x))
}) %>%
image_join() %>%
image_append()
Website and workshop materials developed by Anna Fergusson for the R-Ladies Auckland October 2018 Meetup.