Getting started
Background
During and following my talk, various people asked me if they could use some of the apps I’ve developed as part of my large-scale interactives. My answer was yes, hence this site!
I’m hoping to have a student working on this project with me over our summer (Dec 2018 - Feb 2019), so until then I’ll try to provide enough details to get you started using some web apps that are powered by Javascript, Google apps script and Google sheets. I’m also just going to focus on the tech side of using these web apps and not on teaching with them as part of large-scale interactives.
Google time
These web apps are “contained” within a Google sheet. To use each app with your students, the main steps are:
- make a copy of the Google sheet (use one of the links provided on the Example apps page)
- publish and authorise the web app with the following settings:
- execute the app as you, and
- anyone, even anonymous, has access to the app
- grab the URL of the current web app to share the app with users
- a URL shortener might help, or
- embed this URL in another webpage using an iframe
- use the data collected in the Google sheet however you want!
I’ll now go through each step with a little more detail.
Make a copy of the Google sheet
Use the Google sheet link provided for the app (use one of the links provided on the Example apps page) to open the Google sheet in View only mode. If you are not already logged into your Google account, log in and make a copy of the Google sheet (under the File menu). This will give you a copy of the code used for the web app, as it is contained within the Google sheet. However, before you can use it, you need to authorise the app (which is a good thing!)
Authorise the app
Head to Tools -> Script editor from the main menu options. You will see two files in the side bar of the Google apps script project page.
Code.gs has two functions that take care of displaying the webpage when your app is accessed and adding new rows to your Google sheet. Index.html contains HTML stuff including some Javascript to capture data from user interactions and to call the GAS functions. You are welcome, of course, to adjust any part of the HTML code e.g. change the instructions provided, be explicit about what data will be collected from users who interact with the app etc. Note: I have not included any kind of input validation anywhere.
To get your app up and running, head to Publish -> Deploy as web app from the main top menu. Use the settings shown below (which should be what comes up):
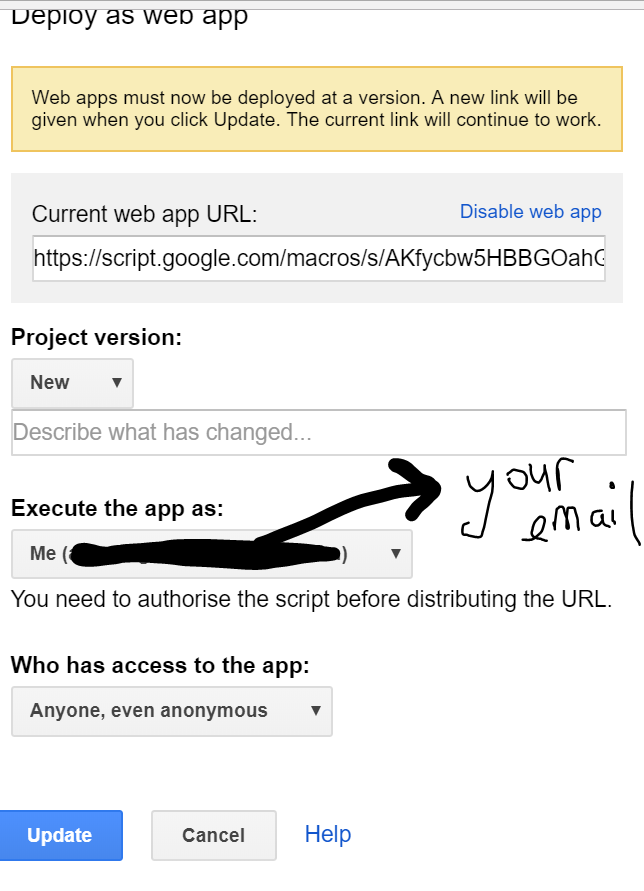
You will be prompted to authorise the app when you click the Update button. You will may then be shown a warning that the app is not verified. In this situation, the app is running under your account to save data from the app to your Google sheet, so if you trust yourself then click the Advanced link on the bottom left of the dialog box. Then click the link Go to APP_NAME_HERE (unsafe). The next screen will show you what you are allowing the app access to (in this case, Google sheets).
Once you’ve signed your life away using the blue Allow button, then grab the URL from the Current web app URL box and test out the link. You should see a new row of data appear on your Google sheet after you’ve interacted with the app.
Use the data!
Since the data is in a Google sheet, you explore the data within Google sheets if that’s your thing. Or….. you could use the data within other software.
I typically give students/others the link to the Google sheet published as a CSV. You can do this by opening your copy of the Google sheet and selecting File -> Publish to the web from the main menu. Under Link select Sheet1 from the first dropdown and Comma-separated values (.csv) from the second dropdown. Then press the blue Publish button and grab the link.
This works pretty well, although there is a delay for new data to be included in the published version. If this link is used directly, it prompts the download of the csv file via the browser. Or you can use the link to read the data into R and other friendly applications.
# read the current data collected from my web app https://annafergusson.github.io/LSinteractives/patience.html
library(readr)
ten_seconds_data <- read_csv("https://docs.google.com/spreadsheets/d/e/2PACX-1vR_K8VZFPwKpV48nsAv_b7-SvE4fS39G_uh-Gdi3wa76k1i4ZhbSk12oHNnJCp5rn1p2yVokBYJOprn/pub?gid=0&single=true&output=csv")
You could also use the fantastic googlesheets package to read the data straight from the Google sheet. Note: The IDs are different for the Google sheet and the published CSV version.
# read the current data collected from my web app https://annafergusson.github.io/LSinteractives/patience.html straight from the public Google sheet
library(magrittr)
library(googlesheets)

#set up authentication the first time
#gs_auth(new_user = TRUE)

#get that data using the ID of the Google sheet
ten_seconds_data <- gs_key("1NfO5rPtLz4EBUfJAWnpXEv-LUU3sKWOyrjPjY0JAMzM") %>%
  gs_read(col_names = TRUE)
This is where I should write more about how to build the apps and data into bigger interactives! In my talk, I demoed using an openCPU app I developed to both use the data live but also to allow students to play with the R code a little. The learnr package would be a nice place to start if you would like to do something similar. At some point I’ll write more about this…
What next?
On the examples page, I’ve added some of the web apps I’ve been using with my students. You are welcome to make copies of these and change however you want (or use them as they are).
If you are a R user, you may want to consider combining Google sheet functionality with Shiny apps. Here a couple of links from the googlesheets documentation: